Retail Tracker #2
Retail Tracker Report
Period ending 05/18/2025
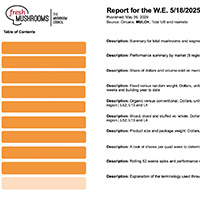
Produced every four weeks, the Retail Tracker Report provides insight into category dollar sales, segment and variety sales, average price per pound, and other helpful metrics.
- Consumer sentiment remained subdued, falling for the fourth straight month over concerns related to personal finances and business conditions.
- According to placer.ai, restaurant visits are starting to stabilize after year-over-year decreases in January and February.
- Placer.ai identified “innovative value” as the common growth factor among areas that are bucking overall trip trends. The six Cs that are experiencing trip growth refer to: coffee, chicken, Chili’s, Cava, Chuck E. Cheese and Chipotle.
- The total produce department grew dollars, units and pounds in the quad-week ending May 18th, but this is driven by fruit. Vegetable sales have experienced dollar pressure for several months running.
- Sales declines were driven by deflation in most months, however, vegetable sales experienced dollar, units and volume declines during the four weeks ending May 18th — signaling weaker demand. Frozen vegetable sales did increase during the same four weeks.
- Mushroom sales at retail also continued to decline. The rate of decline jumped to -6.6% for dollar sales during the quad-week versus -3.1% for the 52-week view.
Download your copy of the quick two-page summary,
the plug-and-play PowerPoint ready for use, and the in-depth Excel data file.


Source: Circana, Integrated Fresh, MULO, 4 or 52 weeks ending 05/18/2025
Recent Tracker Archive
2025
January 2025
February 2025
March 2025
April 2025
2024
January 2024
February 2024
March 2024
April 2024
May 2024
June 2024
July 2024
August 2024
September 2024
October 2024
November 2024
December 2024
2023
January 2023
January 2023
February 2023
March 2023
April 2023
June 2023
July 2023
August 2023
September 2023
October 2023
November 2023
December 2023
December 2023 – Year End
2022
January 2022
February 2022
March 2022
April 2022
June 2022
July 2022
August 2022
September 2022
October 2022
December 2022
Tracker Archive
2021
- 2021 Fresh Mushroom Year in Review DOC
- Mushroom Performance 2021 Year-End PPT
- Period Ending 12/26/2021
- Period Ending 11/28/2021
- Period Ending 10/31/2021
- Period Ending 10/3/2021
- Period Ending 9/5/2021
- Period Ending 8/8/2021
- Period Ending 7/11/2021
- Period Ending 6/13/2021
- Period Ending 5/16/2021
- Period Ending 4/18/2021
- Period Ending 3/21/2021
- Period Ending 2/21/2021
- Period Ending 1/24/2021
2020
- Period Ending 12/27/2020
- Period Ending 11/29/2020
- Period Ending 11/01/2020
- Period Ending 10/04/2020
- Period Ending 09/06/2020
- Period Ending 08/09/2020
- Period Ending 07/12/2020
- Period Ending 06/14/2020
- Period Ending 05/17/2020
- Period Ending 04/19/2020
- Period Ending 03/22/2020
- Period Ending 02/23/2020
- Period Ending 01/26/2020
2019
- Period Ending 12/29/2019
- Period Ending 12/01/2019
- Period Ending 11/03/2019
- Period Ending 10/06/2019
- Period Ending 09/08/2019
- Period Ending 08/11/2019
- Period Ending 07/15/2019
- Period Ending 06/16/2019
- Period Ending 05/19/2019
- Period Ending 04/21/2019
- Period Ending 03/24/2019
- Period Ending 02/24/2019
- Period Ending 01/27/2019
2018
- Period Ending 12/30/2018
- Period Ending 12/2/2018
- Period Ending 11/4/2018
- Period Ending 10/7/2018
- Period Ending 09/9/2018
- Period Ending 08/12/2018
- Period Ending 07/15/2018
- Period Ending 06/17/2018
- Period Ending 05/20/2018
- Period Ending 04/22/2018
- Period Ending 03/25/2018
- Period Ending 02/25/2018
- Period ending 01/28/2018
2017
- Period ending 12/31/2017
- Period ending 12/03/2017
- Period ending 11/05/2017
- Period ending 10/08/2017
- Period Ending 09/10/2017
- Period Ending 08/13/2017
- Period Ending 07/09/2017
- Period Ending 06/11/2017
- Period Ending 05/14/2017
- Period Ending 04/16/2017
- Period Ending 03/19/2017
- Period Ending 02/19/2017
- Period Ending 01/22/2017
2016
- Period Ending 12/25/2016
- Period Ending 11/27/2016
- Period Ending 10/30/2016
- Period Ending 10/2/2016
- Period Ending 9/4/2016
- Period Ending 8/7/2016
- Period Ending 7/10/2016
- Period Ending 6/12/2016
- Period Ending 5/15/2016
- Period Ending 4/17/2016
- Period Ending 3/20/2016
- Period Ending 2/21/2016
- Period Ending 1/24/2016
2015
- Period Ending 12/27/2015
- Period Ending 11/1/2015
- Period Ending 10/4/2015
- Period Ending 11/29/2015
- Period Ending 9/6/2015
- Period Ending 8/9/2015
- Period Ending 7/12/2015
- Period Ending 6/14/2015
- Period Ending 5/17/2015
- Period Ending 4/19/2015
- Period Ending 3/22/2015
- Period Ending 2/22/2015
- Period Ending 1/25/2015
2014
- Period Ending 12/28/2014
- Period Ending 11/30/2014
- Period Ending 11/2/2014
- Period Ending 10/5/2014
- Period Ending 9/17/2014
- Period Ending 8/10/2014
- Period Ending 7/13/2014
- Period Ending 6/15/2014
- Period Ending 5/18/2014
- Period Ending 4/20/2014
- Period Ending 3/23/2014
- Period Ending 2/23/2014
- Period Ending 1/26/2014
2013
- Period Ending 12/29/2013
- Period Ending 12/1/2013
- Period Ending 11/3/2013
- Period Ending 10/6/2013
- Period Ending 9/8/2013
- Period Ending 8/11/2013
- Period Ending 7/14/2013
- Period Ending 6/16/2013
- Period Ending 5/19/2013
- Period Ending 4/21/2013
- Period Ending 3/24/2013
- Period Ending 2/24/2013
- Period Ending 1/27/2013


